Main Dashboard
Dashboard


Overview
The Dashboard is your company’s financial mission-control screen. It pulls live balances, incoming and outgoing cash flows, FX rates, and KPI widgets into a single, always-up-to-date canvas—no more tab-hopping between bank portals or spreadsheets. AI highlights anomalies (e.g., unusual spikes in spend), forecasts runway under different scenarios, and surfaces actionable alerts so your team can react before issues hit the bank account.
Monitor live balances
01
Instantly see consolidated balances across every bank, currency, and entity—automatically updated via open-banking or direct API connections.
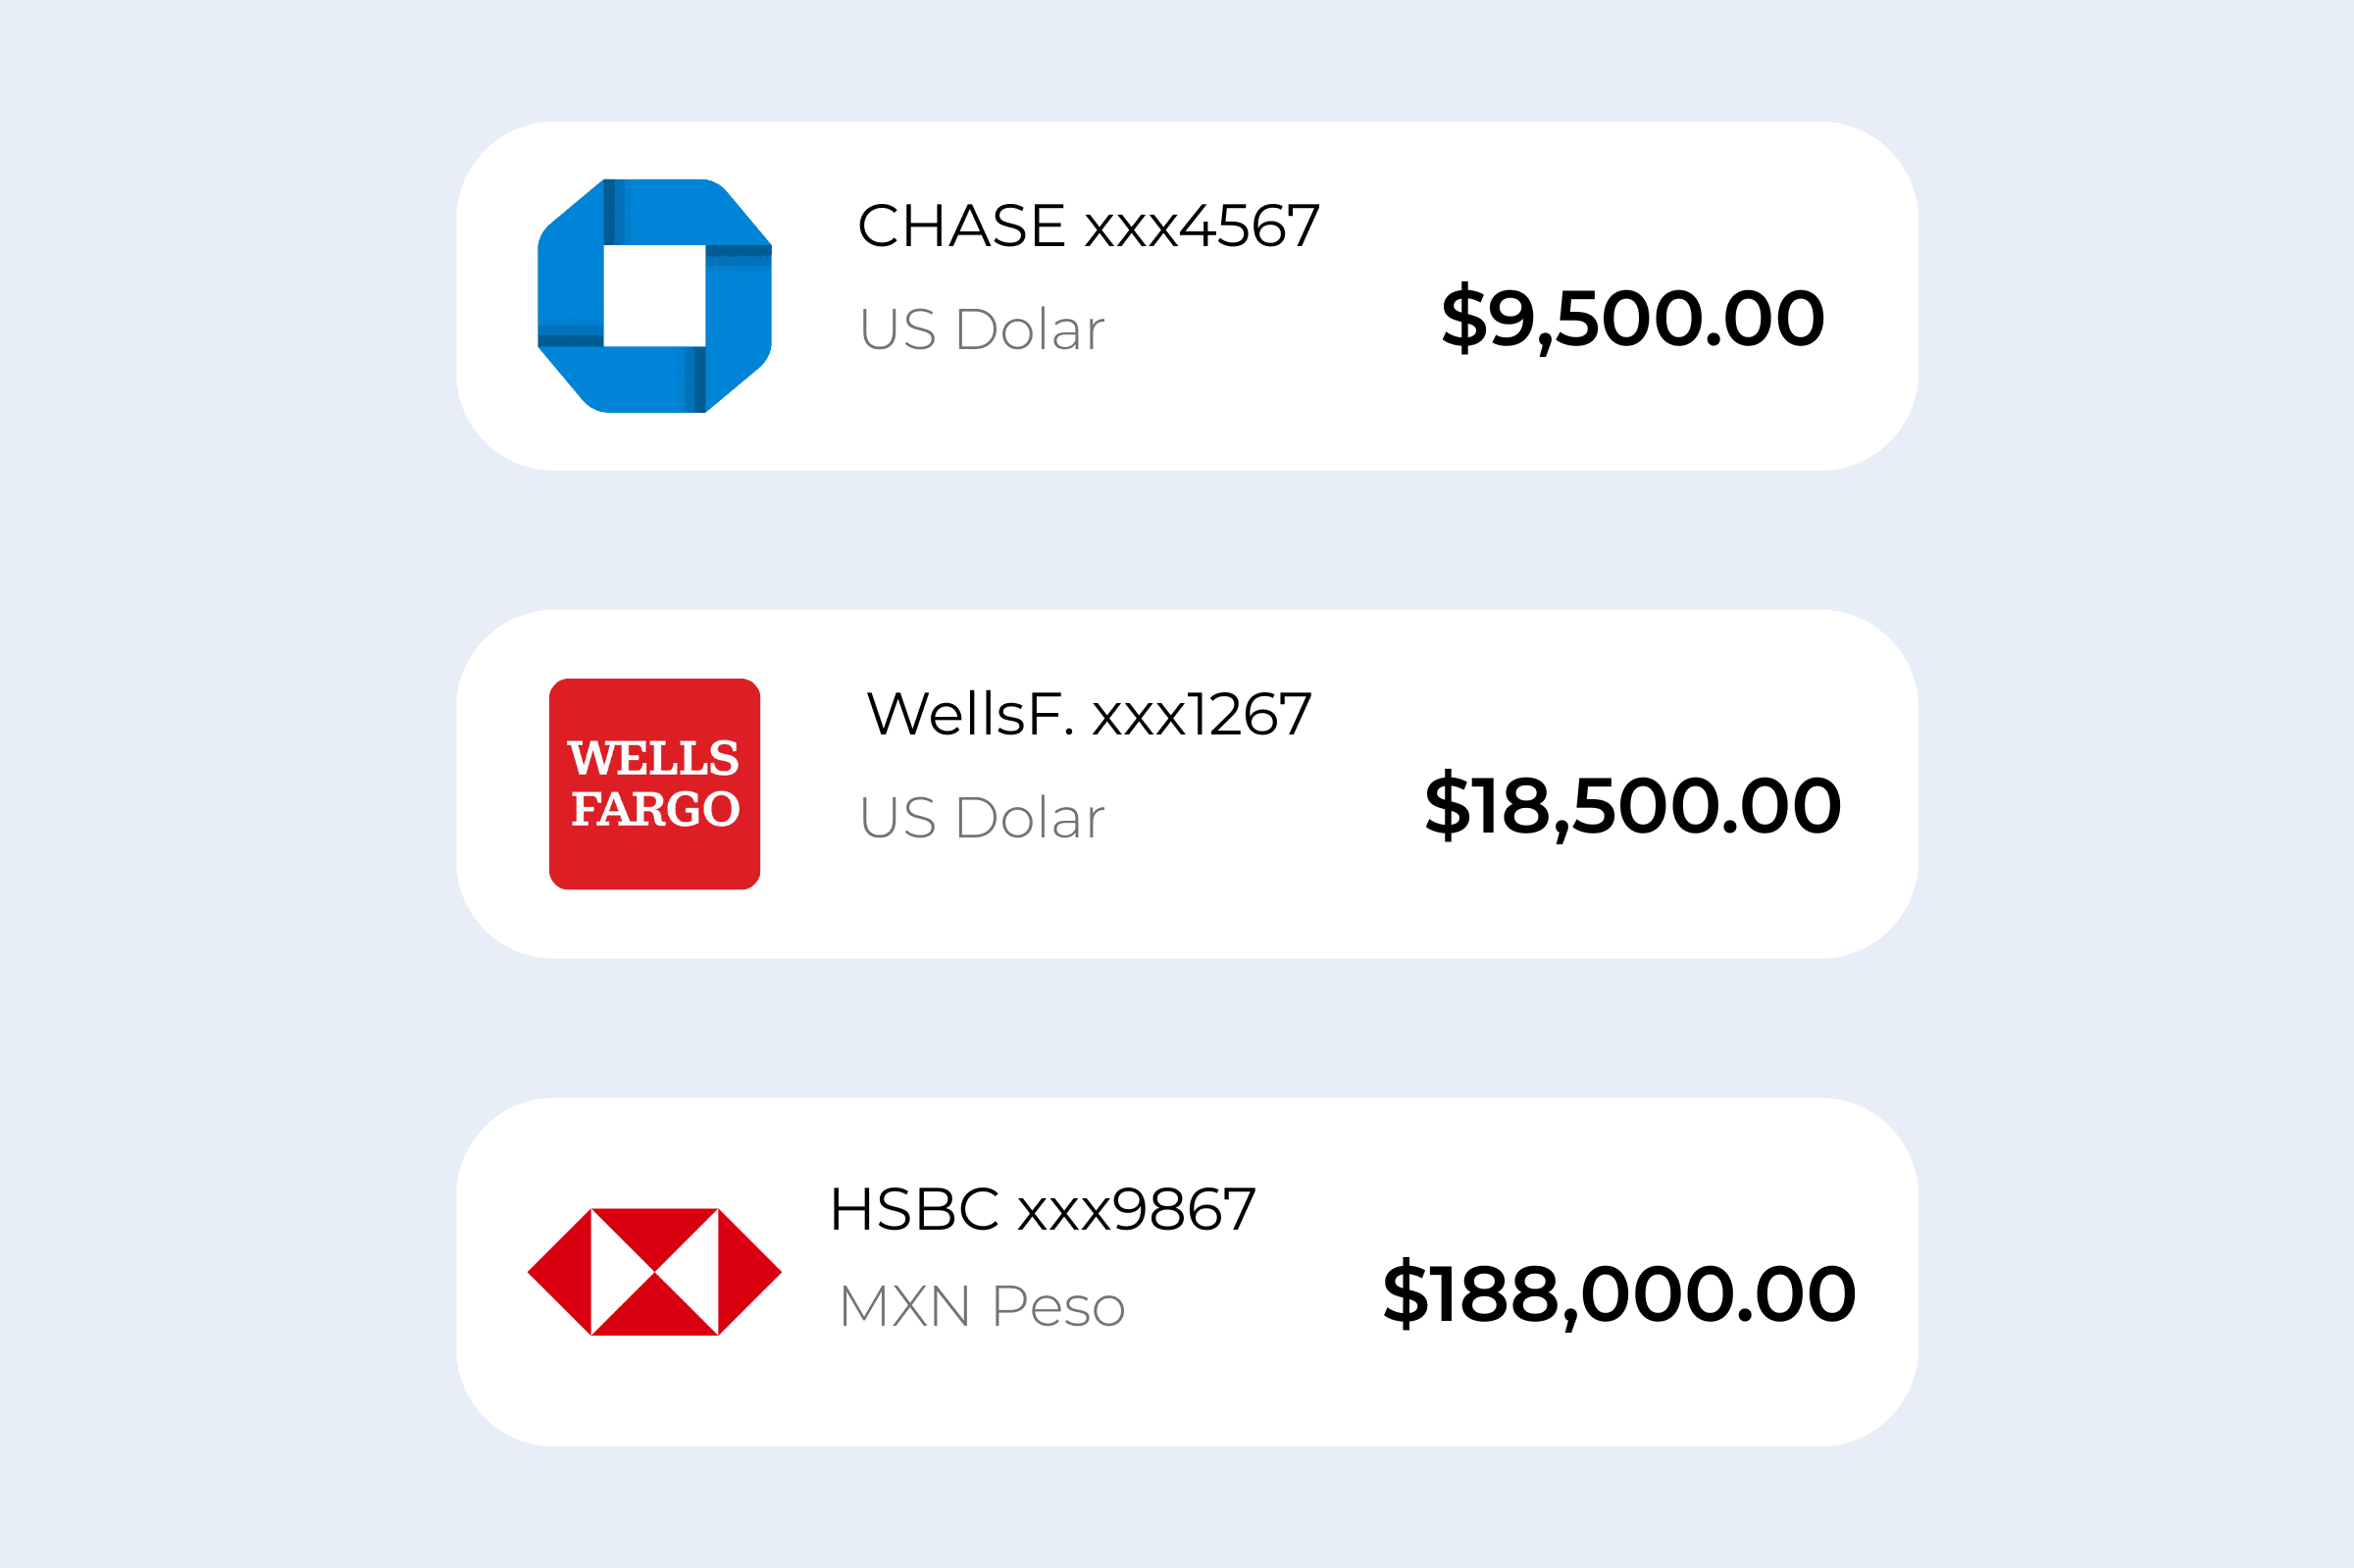
Monitor live balances
01
Instantly see consolidated balances across every bank, currency, and entity—automatically updated via open-banking or direct API connections.
Monitor live balances
01
Instantly see consolidated balances across every bank, currency, and entity—automatically updated via open-banking or direct API connections.
Track upcoming cash flows
02
View a rolling calendar that blends scheduled payables, expected receivables, payroll runs, and recurring SaaS charges into a single lane. The system projects runway under best-, base-, and worst-case scenarios, adjusting in real time as invoices are issued or FX rates swing.
Drill into transactions
03
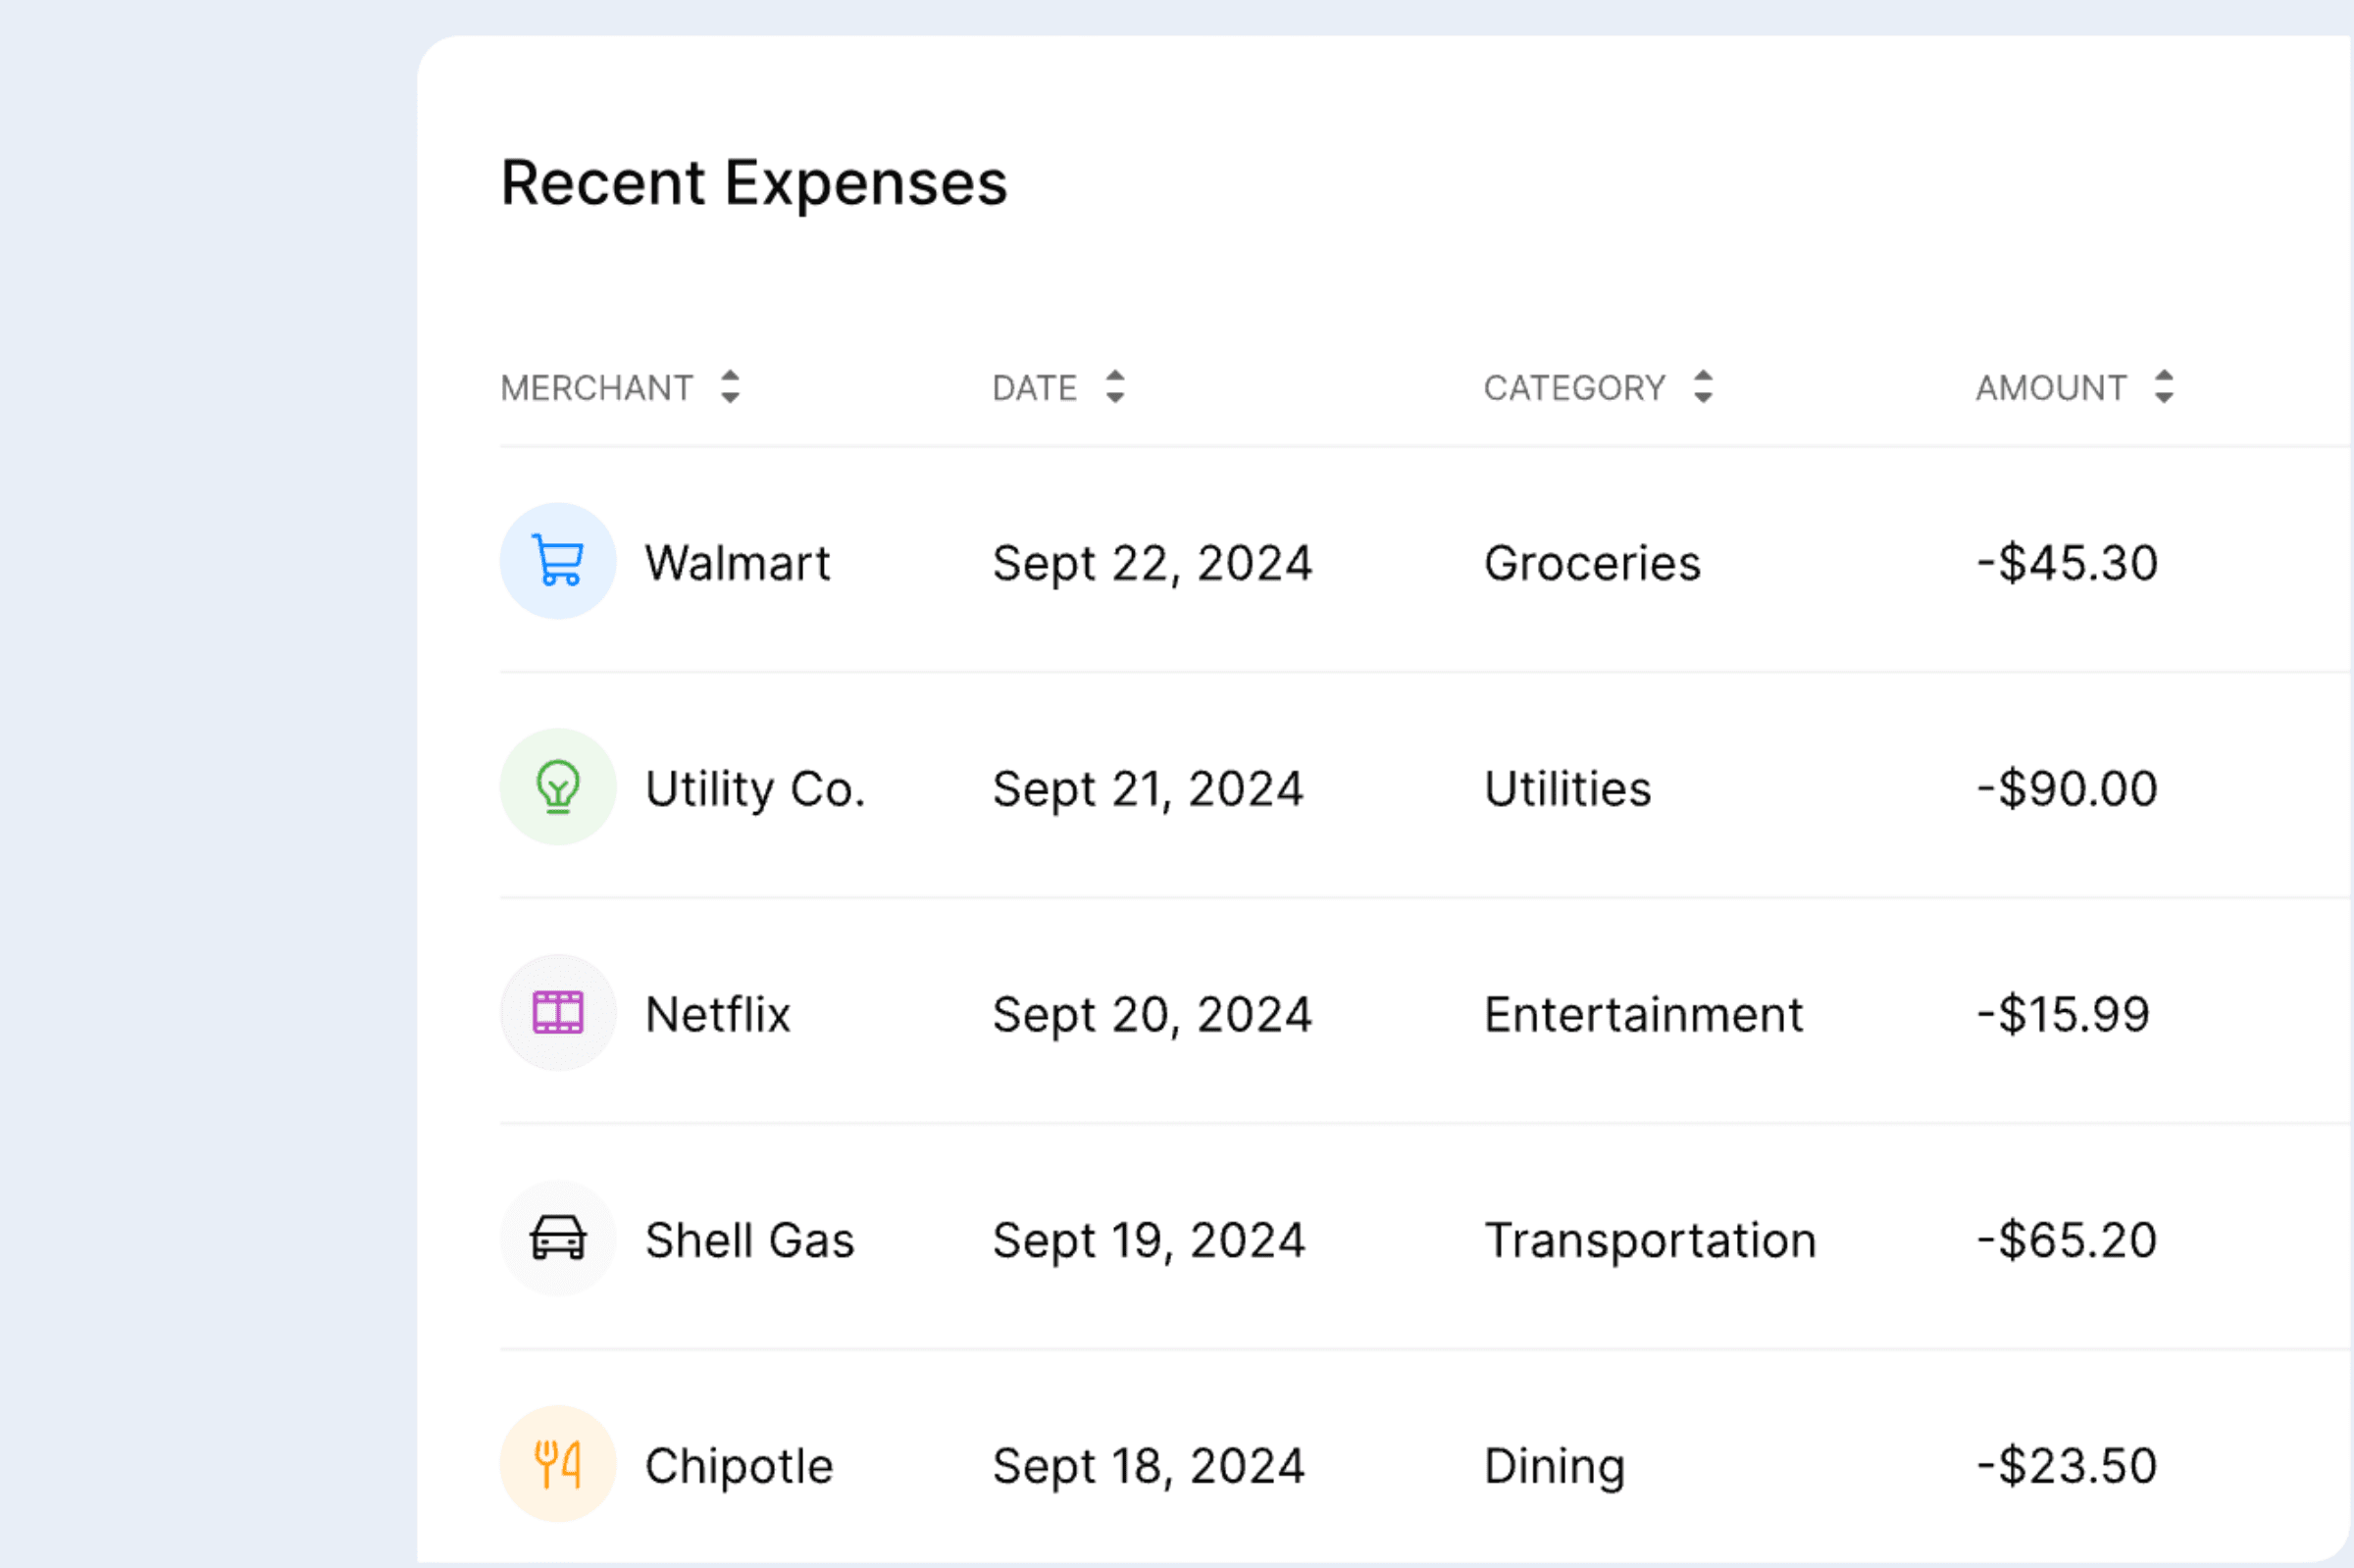
Click any balance or bar on an expense chart to open an interactive ledger where you can search, filter, and tag transactions by vendor, category, project, or cost center. Machine-learning suggestions auto-classify new spend, while bulk-actions let you re-tag hundreds of lines in seconds.

Drill into transactions
03
Click any balance or bar on an expense chart to open an interactive ledger where you can search, filter, and tag transactions by vendor, category, project, or cost center. Machine-learning suggestions auto-classify new spend, while bulk-actions let you re-tag hundreds of lines in seconds.
Discover how Colibri can transform your Finance Department.

Discover how Colibri can transform your Finance Department.
Discover how Colibri can transform your Finance Department.
Main Dashboard
Dashboard
Overview
The Dashboard is your company’s financial mission-control screen. It pulls live balances, incoming and outgoing cash flows, FX rates, and KPI widgets into a single, always-up-to-date canvas—no more tab-hopping between bank portals or spreadsheets. AI highlights anomalies (e.g., unusual spikes in spend), forecasts runway under different scenarios, and surfaces actionable alerts so your team can react before issues hit the bank account.
Monitor live balances
01
Instantly see consolidated balances across every bank, currency, and entity—automatically updated via open-banking or direct API connections.
Monitor live balances
01
Instantly see consolidated balances across every bank, currency, and entity—automatically updated via open-banking or direct API connections.
Monitor live balances
01
Instantly see consolidated balances across every bank, currency, and entity—automatically updated via open-banking or direct API connections.
Track upcoming cash flows
02
View a rolling calendar that blends scheduled payables, expected receivables, payroll runs, and recurring SaaS charges into a single lane. The system projects runway under best-, base-, and worst-case scenarios, adjusting in real time as invoices are issued or FX rates swing.
Drill into transactions
03
Click any balance or bar on an expense chart to open an interactive ledger where you can search, filter, and tag transactions by vendor, category, project, or cost center. Machine-learning suggestions auto-classify new spend, while bulk-actions let you re-tag hundreds of lines in seconds.
Discover how Colibri can transform your Finance Department.
Discover how Colibri can transform your Finance Department.
Discover how Colibri can transform your Finance Department.